
You're Balancing a Budget, Not a Load: Routing Agent Traffic Across Azure OpenAI Endpoints
A Lambda fans out into hundreds of Fargate agents in seconds, all pointed at the same Azure OpenAI deployments. Round robin cannot help, because those deployments are not servers — they are allowances that refill once a minute. What to count, and where.
The shape of the system
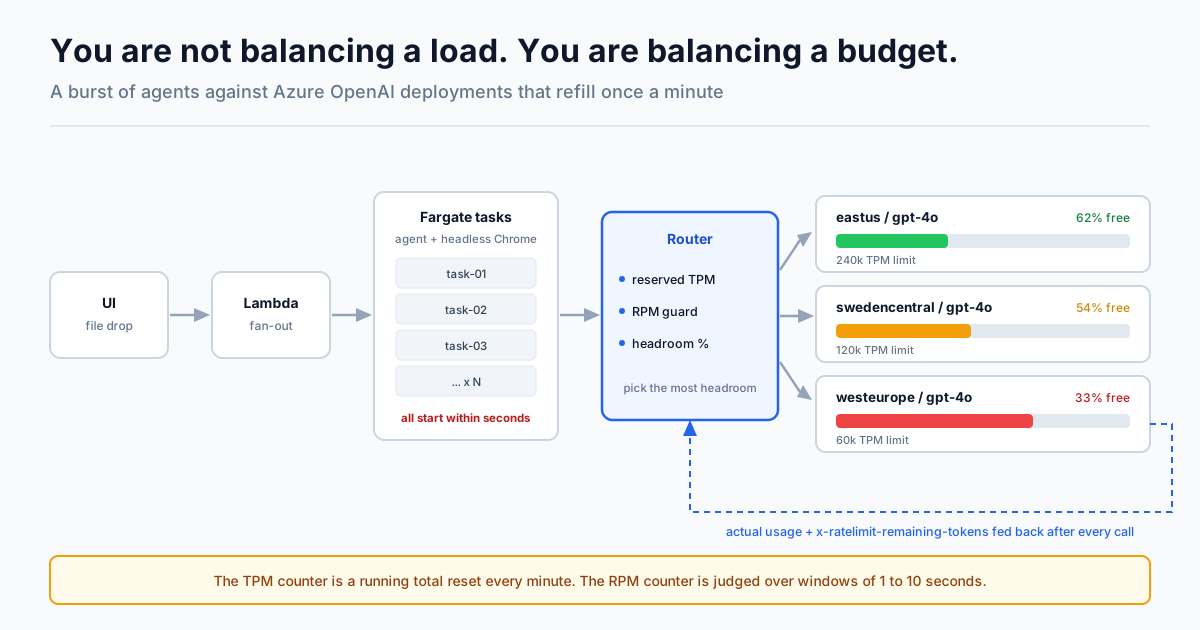
Someone drops a file on a web UI. That triggers a Lambda, which fans out into a set of Fargate tasks — 400 of them for a normal run. Each task runs one agent. Each agent drives a headless Chrome instance over CDP, and each agent calls an LLM to decide what to do with the page it is looking at. Some of the automation is plain selector work, click here and read that. The rest is model-driven. The model does not live on our hardware; it is an Azure OpenAI deployment, and we have several of them.
So the fan-out is the interesting part. This system does not warm up. It goes from zero to four hundred concurrent agents in the time it takes Fargate to pull an image, and every one of them starts talking to Azure at roughly the same moment.
That is where the trouble is, and it took our team a while to describe the problem correctly to ourselves. What follows is what we worked out together — the routing, the instrumentation, and the part we are still not sure about. We want to walk through the reasoning rather than just the conclusion, because the reasoning is the transferable part. We should also say up front which bits we actually shipped and which are the design we would write down if we were starting again; we will flag it as we go, since a post that pretends everything was solved on the first try is not much use to anybody.
This is not a load balancing problem
Here is the reframe that made everything else fall into place.
An ordinary load balancer distributes work across servers. It assumes the servers are interchangeable, permanently available, and that being "busy" is a temporary state that clears on its own. Under those assumptions, round robin is close to optimal and requires no state at all. That is why it is the default everywhere.
An Azure OpenAI deployment is not a server. It is an allowance. You are granted some number of tokens per minute, and the service keeps a running count of what you have spent, and that count resets every minute. When the count is exhausted you do not get slow service, you get a 429. It does not matter how idle the underlying GPUs are.
So the question a router has to answer is not "which server is least busy right now". It is "which allowance has the most left this minute". Those are different questions with different answers, and almost every mistake in this area comes from answering the first one when you meant the second.
Three reasons round robin cannot work here
Worth being specific about why, because each reason points at part of the fix.
Your deployments have different quotas. Azure allocates quota in units of capacity, and you do not get to set the token limit and the request limit independently — they come bundled at a fixed ratio per model. For the older chat models, one unit is 6 requests and 1,000 tokens a minute. That ratio is not universal: on some reasoning models a unit is 1 request and 6,000 tokens, which inverts the whole argument below. Check yours. If you have a 240k deployment in one region and a 60k in another, round robin sends them the same volume and the small one falls over first, permanently.
Your requests differ by two orders of magnitude. One agent step is a 400-token check: small DOM snippet, did the click land, yes or no. The next step from the same agent serialises a search results page with its accessibility tree and sends 40,000 tokens. Both are one request. Round robin counts them as one each.
There is no time to average out. This is the one people miss. Round robin works in practice because over thousands of requests the variance washes out. A Lambda fan-out has no "over thousands of requests" — it has one instant, in which four hundred containers all make their first call simultaneously. The law of large numbers never gets a chance to help you.
Before you build anything, two things to check
We have watched teams build a whole routing layer on a foundation that could not work. Both of these take five minutes and one of them may mean you can stop reading.
First: your deployments may be the same budget wearing different names. From Microsoft's architecture guidance:
"Standard quotas are subscription level, not instance level. Load balancing against standard instances in the same subscription doesn't achieve additional throughput."
Read that twice. Five deployments in the same subscription and region give you five names for one number. Quota is allocated per region, per model and per deployment type, so the escape routes are different regions, different subscriptions, a different deployment type, or provisioned throughput. Nothing else.
Second, and this is the one we wish we had checked first: you may not need a router at all. The same guidance is blunt about it:
"Don't implement a unified gateway solely to increase quota. Use Global Standard deployments that use Azure's global infrastructure to dynamically route requests to datacenters that have the best capacity for each request."
Global Standard is a separate quota pool from Standard in the same subscription and region, and Azure does the capacity-finding for you. If your data residency rules allow a global deployment, that is a configuration change against a routing layer you would otherwise design, build, operate and debug. For a four-hundred-container burst it is the first thing to reach for.
We had a residency constraint that ruled it out. If you do not, take the shortcut — the rest of this post is what you do when you cannot.
And whatever you land on: every endpoint in the pool must be the same model at the same version. Balancing across version X and version X+1 means your agents get subtly different behaviour depending on which way the router flipped, and you will spend a long time chasing a bug that is really a routing decision.
What Azure actually counts
This is the section we wish someone had written for us before we started.
When a request arrives, Azure does not wait to see what it costs. It computes an estimated max-processed-token count at admission, and adds that to the running minute counter. Per the docs, that estimate includes the prompt text and count, the maximum answer length you asked for, and the number of candidate completions you asked it to generate.
And there is a warning attached that deserves more attention than it gets:
"The token count used in the rate limit calculation is an estimate based in part on the character count of the API request. The rate limit token estimate isn't the same as the token calculation that is used for billing."
Two separate counters, computed two different ways. The one you get billed on is not the one that 429s you. Which explains the experience of watching your usage dashboard sit at 40% while requests bounce — and it means everything below is about throughput, never about money.
Now follow the consequence through, because it is the single most valuable thing in this post.
Your rate limit is charged on the maximum answer length you declared. Not on what the model wrote. If you leave that at 4096 out of habit — and everybody does, it is the number in the sample code — then a call whose answer is "click element #37" consumes four thousand tokens of headroom that no one ever used.
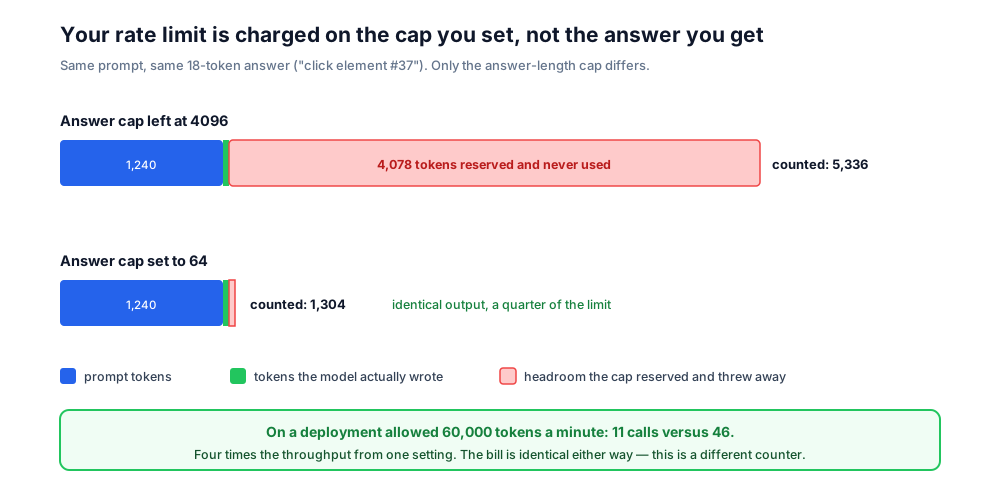
For a browser agent this is brutal, because the overwhelming majority of steps produce tiny outputs. A handful of calls genuinely need room to write — the planning step, the summarisation at the end. The rest are picking an element or answering a yes/no.
So: set the answer-length cap per call type, not once at the top of the file. It is a one-line change per call site, it needs no infrastructure, and on the numbers above it is worth roughly four times the throughput. Do this before you build any routing, or you will build a beautiful balancer to distribute waste evenly.
While you are there, the docs make the same point about the other multiplier: ask for one completion unless you specifically need several, because each extra candidate multiplies the token count charged against your rate limit.
The other counter, the one that actually bites a fan-out
The token limit is evaluated over a one-minute running count. The request limit is not. Azure evaluates request rate over windows of one or ten seconds:
"Azure OpenAI evaluates the rate of incoming requests over a small period of time, typically 1 or 10 seconds. If the number of requests received during that time exceeds what would be expected at the set RPM limit, then new requests receive a 429."
Do the arithmetic for our architecture. A 60k-token-a-minute deployment on the six-requests-per-thousand ratio is 360 requests a minute. On a ten-second window that is 60 requests; on a one-second window it is six.
Four hundred Fargate tasks coming up at once, each making its first call inside the same second, is four hundred requests into a window that will accept sixty at best and six at worst. That is somewhere between seven and sixty times over the limit, and you have spent almost none of your token budget to get there. Spread across three deployments it is still multiples over on each.
There is no arrangement of endpoints that absorbs a four-hundred-container cold start arriving in one second. The fix has to be in the fan-out, not the routing. If your 429s arrive in a spike right at job start and then settle down, it is the request limit, not the token limit, and no amount of token accounting will touch it.
Fewest tokens used is the wrong comparison
You now know what to count. The next question is how to compare endpoints, and the obvious answer is subtly wrong.
The instinct is to send the next request to whichever endpoint has consumed the fewest tokens this minute. That is right in spirit and wrong in arithmetic, because it ignores that the endpoints have different sized budgets.
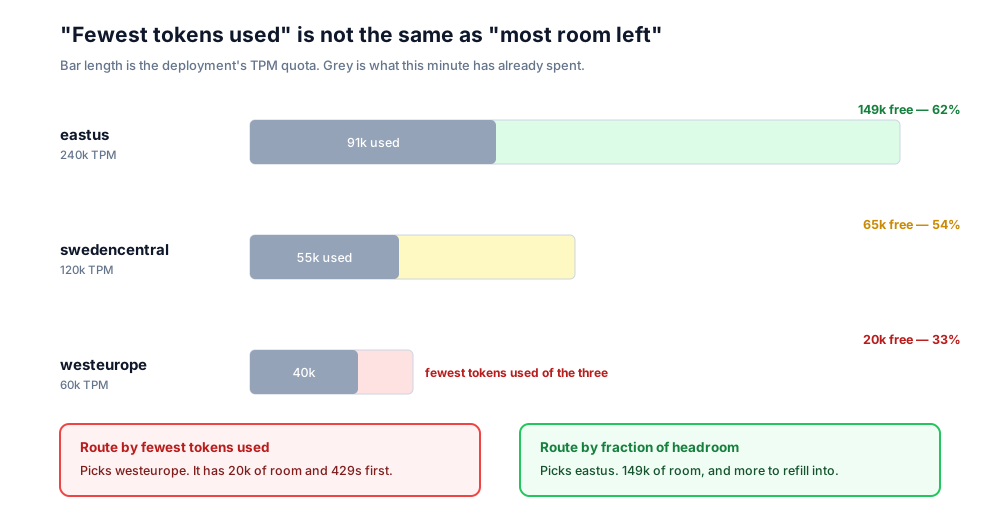
West Europe has used the fewest tokens and has the least room. Compare the fraction of headroom remaining — the room left on an endpoint divided by that endpoint's own limit — and pick the largest. One division, and it is the difference between a balancer that works and one that reliably targets your smallest deployment.
Where the count lives
Here is the part that makes this an architecture problem rather than a function. Your Fargate tasks are stateless and short-lived and they cannot see each other. A per-container counter is worse than useless — each one thinks it has the whole budget, and four hundred of them are confidently wrong in the same direction at the same instant.
The count has to be shared. Redis on ElastiCache is the obvious home; a table with atomic counters works if you would rather not run Redis. The pattern that matters is reserve, then settle up, and there are four details that decide whether it works. Three of the four we got wrong on the first pass, and each one cost us a debugging session:
- Reserve before you dispatch, not after. Add the pessimistic estimate — the prompt plus whatever answer-length cap you are about to send — to that endpoint's counter for the current minute, and only then make the call.
- The reservation must be a single atomic operation. Increment and read back the new value in one step, and give the excess back if you have overshot the limit. Reading the counter and then writing it is two operations with a gap in the middle, and at four hundred concurrent containers something lands in that gap on essentially every burst.
- Guard the request rate separately, in its own short-window counter. The token limit and the request limit are different limits on different clocks, and a token-only guard sails straight into the wall described above.
- Settle up against the key you reserved on. When the response returns, adjust the same minute's counter — not whichever minute it happens to be now. A call that straddles a minute boundary otherwise credits the next minute, driving that counter negative and over-admitting at exactly the wrong moment.
Two more things worth saying plainly. Leave a safety margin — we work to about 85% of the stated limit — because your model of Azure's estimate is approximate by construction: theirs is partly character-count based and not fully specified. And do not let every container pick the same winner. If four hundred processes all deterministically choose "the endpoint with the most headroom", they all choose the same one, and you have rebuilt the stampede with extra steps. Take the best two and pick one at random.
The headers, and how much to trust them
Every response carries the state of both counters. There are seven of them, and they matter in this order:
- The token limit header tells you the limit currently in force. Read that carefully: currently. It moves, and the next section is about why.
- The remaining-tokens header is your headroom in the current window.
- The request limit and remaining-requests headers are the same pair for the other counter.
- Two reset headers tell you when each counter clears.
- A retry-after header appears on a 429, in milliseconds. Use it rather than inventing your own backoff.
Use these to correct your counter, not to drive it. They arrive one round-trip late, so they tell you where you were, not where you are.
But the first one deserves more than a correction role, because your configured limit is not the limit you are actually operating under:
"Standard (pay-as-you-go) deployments share a resource pool. When demand approaches capacity limits, the system temporarily reduces your deployment's effective rate limit to maintain reliability for all customers. This reduction is protective and temporary."
Which means requests that would normally be accepted start returning 429 even though nothing about your configuration changed. The docs name the tell: compare the token limit header against the quota you configured, and if the header is lower, an adjustment is active. If you hard-code the limit into your router — as our first version did — you will keep dispatching against a number Azure has quietly stopped honouring. Feed the observed header back into the config instead.
The part where Microsoft says don't do this
We would be selling you something if we left this out. The same guidance that told you to reach for Global Standard is equally blunt about predictive accounting:
"Attempting to predict throttling events before they happen by tracking model consumption through prior requests is possible in the gateway, but this approach is fraught with edge cases. In most cases, it's best not to try to predict throttling events, but to use HTTP response codes to drive future routing decisions."
They are right about steady-state traffic. If requests arrive continuously, a reactive circuit breaker is simpler, has no shared state to get wrong, and converges to the same place. The predictive counter is a pile of edge cases — clock skew, the settle-up window, containers that die mid-request and never give their reservation back, and a limit that moves underneath you.
But look at what "use response codes to drive future routing" means for a cold fan-out. The first request from every container is also that container's first opportunity to learn anything. Four hundred containers each independently discover the endpoint is full, each pay a failed round-trip to find out, and each start backing off at the same instant on the same schedule. Reactive routing needs a feedback loop, and a synchronised burst does not give it one. The larger the fan-out, the worse that argument gets for them and the better it gets for predictive admission.
That argument took us a while to settle internally, and the answer we landed on is a hybrid:
- Predictive accounting for admission, because it is the only thing that helps on the first request of a burst.
- Reactive circuit breaking for everything after, because response codes are ground truth and your estimate is not.
- Never let the predictive layer be the only thing standing between you and a 429. It reduces them. It does not eliminate them, and anything that assumes otherwise breaks in production.
And if you are already on Azure API Management, much of this exists as configuration rather than something you build. It enforces token limits at the gateway, emits per-dimension consumption metrics, and its backend pools support round-robin, weighted, priority-based and session-aware balancing with a circuit breaker that takes its trip duration from the backend's own retry hint. If your traffic is steady, use it and skip this whole article. Our fan-out shape is what pushed us toward doing the accounting ourselves.
What to put on the dashboard
We built these after the fact and wished we had them from the start. Emit them from the Fargate tasks as CloudWatch embedded metric format, dimensioned by endpoint.
Reserved tokens as a fraction of limit, per endpoint. Per endpoint. Never aggregated. If one deployment is pinned at 95% and three others are at 10%, the average is a comfortable 31% and your dashboard is lying to you.
Headroom spread: max minus min across endpoints. One number that tells you whether the routing is doing anything at all. When the spread widens while total throughput stays flat, something is wrong with the balancer, and you now have a metric that says so instead of a hunch.
429 rate, split three ways. The three causes have three different fixes, and the wrong diagnosis wastes a week:
- Token limit. Remaining tokens were at zero. Fix it with more budget, or a smaller answer-length cap.
- Request rate. Remaining requests were at zero. Fix it by staggering the fan-out.
- Temporary adjustment. The limit header is below the quota you configured. Nothing here is yours to fix — back off and spread the load until it lifts.
Reservation error: the estimate you charged yourself divided by the tokens actually used. This is the panel nobody builds and the one that pays for itself. If the ratio sits at 4, you are throwing away three quarters of your throughput to an oversized answer-length cap, and you will not find that out any other way.
Effective limit against configured limit, per endpoint. Straight from the header. This is how you see a temporary adjustment while it is happening rather than a day later.
Active Fargate tasks against total reserved tokens. The admission control view — whether you are running the right number of agents for the budget you actually have.
Sizing the fan-out from the budget
The Lambda decides how many containers to start from the work to be done. It should also be asking whether the token budget can feed them: total tokens a minute across your endpoints, keep 85%, divide by what one agent consumes in a minute.
Run it backwards for four hundred agents at four steps a minute — 1,600 calls. At the lazy 4096 cap each is charged about 5,336 tokens, so the fleet demands roughly 10 million tokens a minute, which is not a number you are getting on standard quota. Tighten the cap and the same fleet needs about 2.5 million: still a serious quota conversation, but a reachable one.
Read it the other way and it is more sobering. Hold 420k across three deployments and you can feed about 16 agents at the lazy setting, or 68 after tightening. Start four hundred against it anyway and most of them spend their lives in backoff, each holding a browser and a Fargate task's worth of billing while doing nothing.
Fleet size is not a scaling decision, it is a division. And the denominator is a setting most people copy from the sample code and never look at again.
If you are starting from scratch
- Check whether Global Standard solves it. If residency rules allow it, stop here.
- Verify your deployments are separate budgets. Different regions, subscriptions or deployment types, or nothing below helps.
- Set the answer-length cap per call type. Biggest single win, no infrastructure.
- Instrument before you route. You want the before picture.
- Stagger the fan-out and cap concurrency from the budget. This is most of your 429s.
- Then build the shared counter and route by headroom fraction.
- Keep a reactive circuit breaker underneath all of it.
We arrived at that order backwards — routing first, instrumentation last — and every step out of sequence cost more than it saved. It is the one thing here we would defend hardest.
The part we are still not sure about
When a response comes back having used far less than we reserved, the obvious move is to give the difference back. But nothing in the documentation says Azure releases the unused portion of its own estimate inside the same minute, and the answer-length section above is evidence that it does not. Refunding ourselves makes our counter more optimistic than theirs, which quietly eats the safety margin we added for exactly the opposite reason. So we hold the pessimistic figure for the full minute and admit less work than we probably could. The team is not unanimous that this is right, and it is the first thing we would measure properly.
Underneath it: you are maintaining a model of somebody else's counter, computed by a rule you can only partly see, against a limit that can move without telling you. That margin is not a temporary hack you will eventually remove. It is the permanent cost of not owning the thing you are rate limiting against — which is, in one sentence, the argument for reaching for Global Standard before you build any of this.
This write-up is the work of the engineering team at Idea Infotech who built and ran the system it describes. We build agent systems and the infrastructure under them for enterprise and government deployments in India. If you are sizing or debugging a fleet like this one, we are happy to talk.